Interactive Stock Charts 1.22
Continue to app
Free Version
Publisher Description
Interactive Stock Charts © is the most intuitive and advanced stock analysis charting app. You can freely adjust time frame and view technical information with touch of finger: scroll, pan and zoom on a beautiful candlestick charts with gesture and touch control. Swipe to scroll into historical analysis, pinch to zoom and change time frame, touch on pri1ce points to show detailed quotes and technical indicator values. Backed by Screenulator's patent pending automated chart pattern and trendline recognition engine, and industry's first 9,13 indicator completion screener! Interactive Stock Charts also comes with a powerful technical analysis tool set and realtime RSS news feed to give you an edge over the market!
Using AI-based Deep Learning Neural Networks algorithms, Screenulator detects highly proftable chart patterns and reliable trendlines, TR/TD Indicators signals, as well as candlestick patterns. Backtested with 50+ years of historical big data, it ensures the you always have an edge against increasingly unpredictable markets! All Screenulator chart patterns are available on website for existing subscribers.
Historical price data is stored locally in your device. In "Offline mode", you can analyse historical charts and manipulate charts fast without any network delay. "Offline caching" allows you download all charts in portfolio prior to going offline.
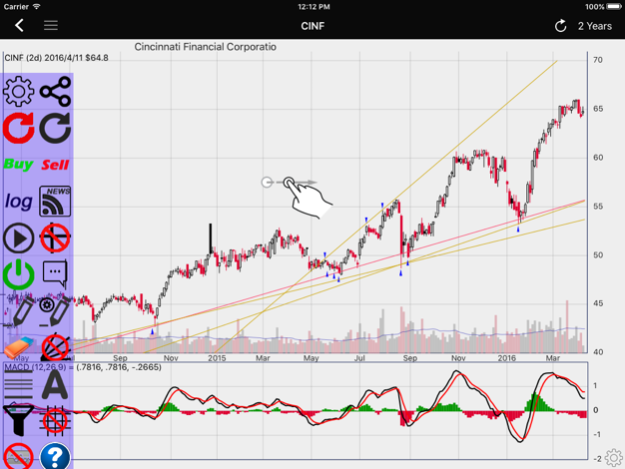
About Trendlines:
A trend line is a bounding line for the price movement of a security. A support trend line (or a bottom line) is formed when a securities price decreases and then rebounds at a pivot point that aligns with at least two previous support pivot points. Trendlines are considered by many expert traders to be the single most important tools in technical analysis. However, Support and Resistance breakout and Triangle patterns are just example of patterns formed by trendlines. This app automatically draws and screens for stocks with specific patterns.
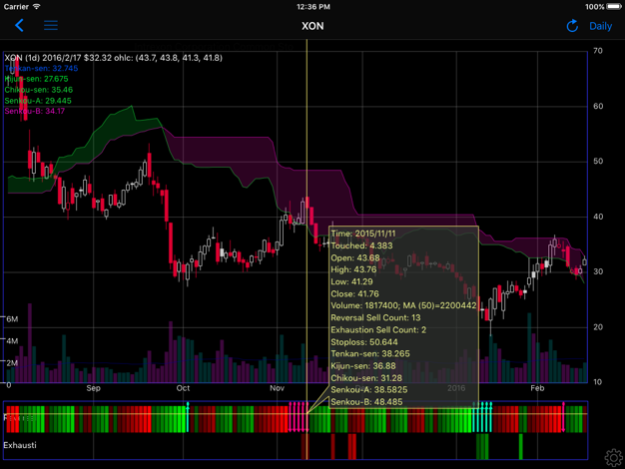
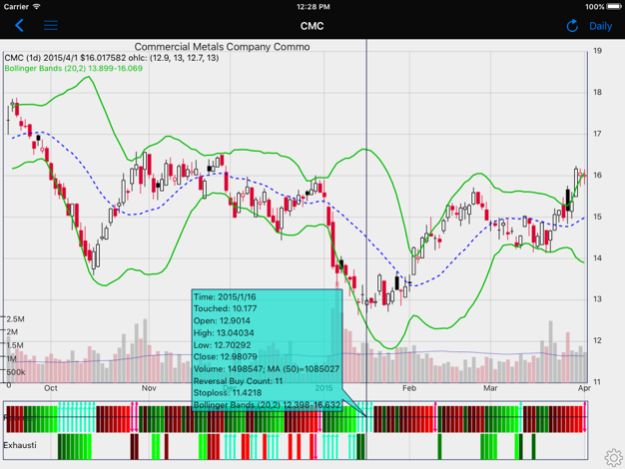
About Trend Reversal Indicator:
Screenulator's patent pending Trend Reversal and Exhaustion indicators combines 9,13 counting with trendline analysis to pinpoint trend pivots with color coded visual indicator. It has been shown to have an impressive record of identifying and anticipating turning points across the FX, bond, equity and commodity markets. Furthermore, the indicators provide signals not only on a daily chart but also intraday. It identifies when a trend is becoming, or has become, exhausted. This apps automatically identifies Trend Reversal, Trend Exhaustion, and Perfection criteria. It also calculates stoploss levels.
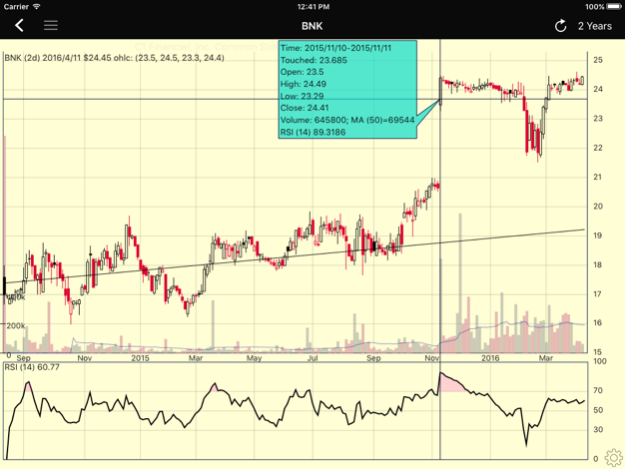
Classic TA indicators and overlays: RSI, MACD, SMA, EMA, Donchian, Bollinger, Keltner Parabolic SAR, McGinley Dynamic, Ichimoku Cloud, Full Stochastic, Fast/Slow Stochastic, Supertrend, Pivots, ADX, Aroon, Chaikin, Ultimate Oscillator, MFI, OBV, ATR, ADL, CCI indicators. Fibonacci Retracement and text annotation tools. Others will available upon requests.
Supported markets:
NASDAQ, NYSE, AMEX, NSE, TSX
Mar 30, 2018
Version 1.22
This app has been updated by Apple to display the Apple Watch app icon.
Support KL, SGX and Shenzhen markets
About Interactive Stock Charts
Interactive Stock Charts is a free app for iOS published in the Accounting & Finance list of apps, part of Business.
The company that develops Interactive Stock Charts is Yue Qi. The latest version released by its developer is 1.22.
To install Interactive Stock Charts on your iOS device, just click the green Continue To App button above to start the installation process. The app is listed on our website since 2018-03-30 and was downloaded 14 times. We have already checked if the download link is safe, however for your own protection we recommend that you scan the downloaded app with your antivirus. Your antivirus may detect the Interactive Stock Charts as malware if the download link is broken.
How to install Interactive Stock Charts on your iOS device:
- Click on the Continue To App button on our website. This will redirect you to the App Store.
- Once the Interactive Stock Charts is shown in the iTunes listing of your iOS device, you can start its download and installation. Tap on the GET button to the right of the app to start downloading it.
- If you are not logged-in the iOS appstore app, you'll be prompted for your your Apple ID and/or password.
- After Interactive Stock Charts is downloaded, you'll see an INSTALL button to the right. Tap on it to start the actual installation of the iOS app.
- Once installation is finished you can tap on the OPEN button to start it. Its icon will also be added to your device home screen.
